
Small Business Petty Cash Tracker
Log petty cash in and out, record top-ups, and check counted cash against the expected balance.
View on Etsy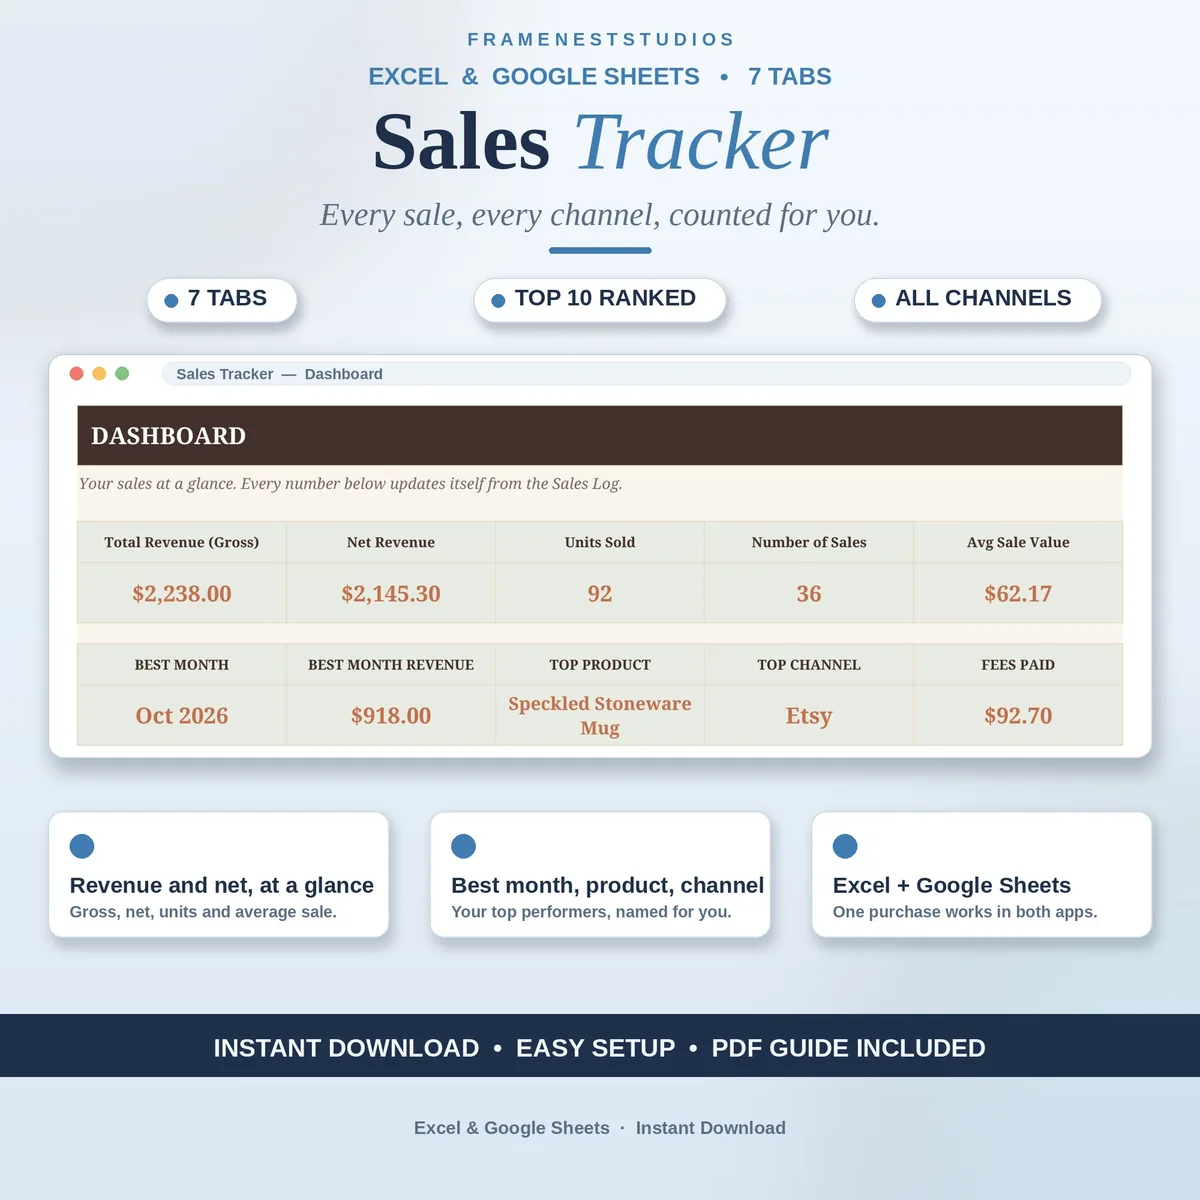
Ask where last month money really came from and most sellers end up guessing across three apps. This sales tracker puts every sale on one line, whichever channel it came through, then counts revenue, fees and rankings for you as you go.
Sale price in our Etsy shop right now. Checkout, payment and instant delivery are handled by Etsy.
The habit is simple: one line for every sale. Product, date, quantity, selling price, category and channel, with the line total worked out and fees taken off in a Net column. Whether a sale happened on Etsy, your own website, Instagram, a market stall or wholesale, it lands in the same log, so the record stays complete without extra effort.
From that one list, the workbook builds the views you actually make decisions with. The dashboard shows gross takings, what remains once fees come off, how many units and sales you made and the typical sale value, plus the month, product and channel that performed best for you. The monthly summary separates a genuinely good month from a merely busy one by showing gross, fees and net together.
Products are typed once and feed the dropdown on the log, with each product units and gross counting themselves. The Top Sellers tab ranks your top 10 by the money they bring in, with a chart of the top 5, while the Channels tab sets each route to market side by side with its share of sales. The log holds 50 sale lines and the product list holds 20 products to start.
The things buyers ask us most.
Yes, that is exactly the point. Every sale line carries its channel, whether that is Etsy, your website, Instagram, markets, wholesale or another route. The Channels tab then breaks the totals down again by route, so sales, fees and net can be compared channel by channel instead of guessing which one earns its keep.
No updating at all. It reads your product totals, which count units and gross straight from the Sales Log, and sorts your ten best earners into order automatically. Add a sale and the ranking reshuffles itself. A chart of the top 5 updates along with it.
Whatever that sale cost you to make, things like marketplace charges, card processing costs, or your share of a market stall fee for the day. The Net column subtracts fees for you, and the dashboard adds up everything you have paid in fees, making it much easier to see what each channel really costs you.
You start with room for 50 sales in the log and 20 lines on the product list, enough room for most small shops to run with for quite a while. If you need more room, insert rows inside the tables and copy the formulas down. It takes about a minute, and the summaries pick the new lines up automatically.
Three more workbooks from the same shelf.
Log petty cash in and out, record top-ups, and check counted cash against the expected balance.
View on EtsyA 13 week cash flow forecast that flags tight weeks before they arrive.
View on EtsyA 13-week and 12-month forecast that flags tight weeks before they can hurt.
View on Etsy